
Understanding Crime Trends in the Charleston Area
Charleston and the surrounding Lowcountry continue to grow rapidly, and with that growth comes shifting crime patterns. While many neighborhoods remain safe overall, property crime trends vary significantly by area, property type, and time of day.
This 2026 update looks at crime trends by neighborhood across Charleston and nearby communities, helping homeowners and business owners understand risk and make informed security decisions.
| Area | Overall Crime Trend | Violent Crime | Property Crime |
|---|---|---|---|
| Downtown Charleston | ⬇ Declining | ⬇⬇ Significant drop | ⬆ Slight increase |
| North Charleston | ⬇ Improving | ⬇⬇ Strong decline | ⬆ Still elevated |
| Mount Pleasant | ➖ Stable / Low | ⬇ Very low | ⬇ Declining |
| James Island | ⬇ Declining | ⬇ Low | ➖ Moderate |
| West Ashley | ⬇ Declining | ⬇ Slight drop | ⬆ Mixed |
| Summerville | ➖ Mixed | ⬇ Zero homicides | ⬆ Moderate |
| Goose Creek | ➖ Near average | ⬆ Slightly elevated | ➖ Average |
North Charleston Crime Statistics and Trends
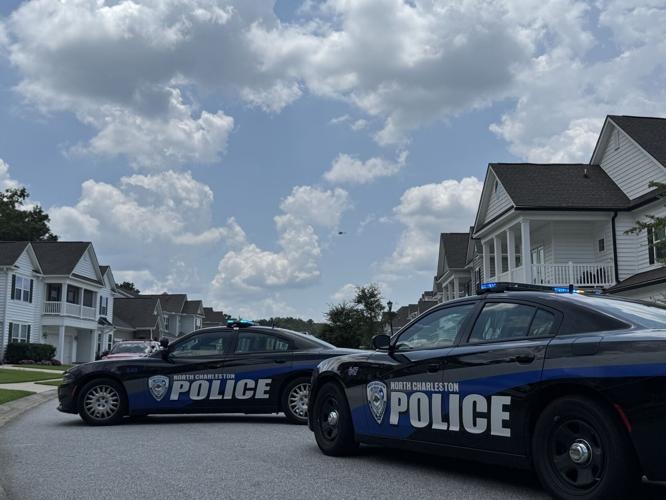
As of late 2025, North Charleston is showing measurable improvement in overall crime, according to local law enforcement data. Police reported an 11 percent decrease in violent crime through September 2025, including significant reductions in homicides, robberies, and aggravated assaults. Homicides alone dropped by approximately 38 percent, signaling progress in some of the city’s most serious crime categories.
North Charleston Crime Snapshot (2025–2026)
| Metric | Change |
|---|---|
| Violent Crime | ↓ 11% (2025 YTD) |
| Homicides | ↓ 38% |
| Property Crime | Above national average |
| Firearm Theft | High incidence from unlocked vehicles |
| DUI Arrests | Increased during targeted patrols |
Violent Crime Trend
| Year | Violent Crime Trend |
|---|---|
| 2023 | Higher |
| 2024 | Moderate decline |
| 2025 | Continued decline |
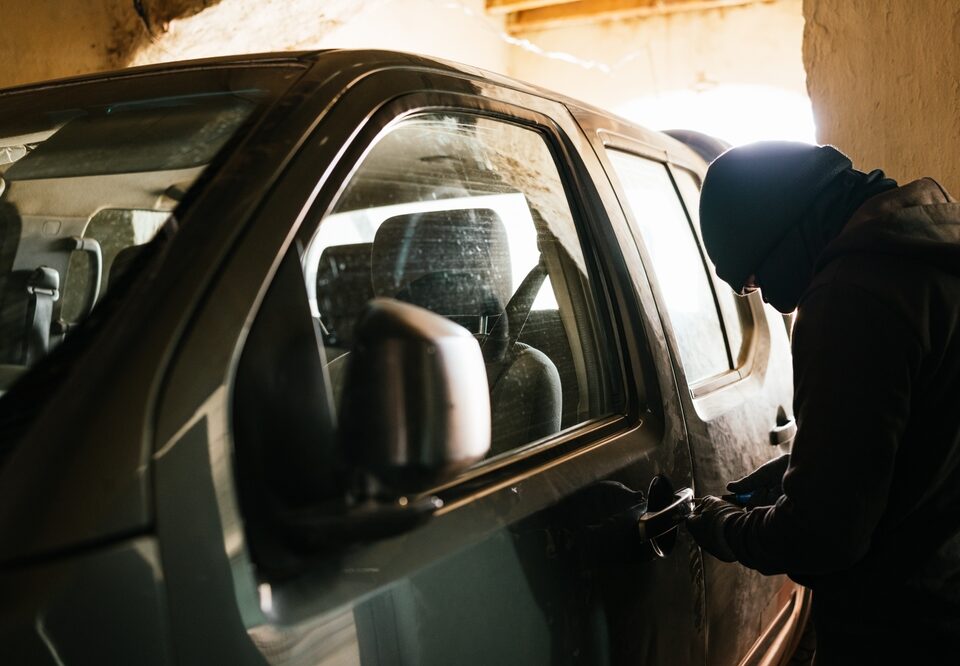
That said, North Charleston still experiences higher crime rates than the national average, particularly when it comes to property crime. Vehicle theft remains an ongoing concern, and prior reports noted a high number of firearms stolen from unlocked vehicles, underscoring the importance of vehicle security. DUI arrests also increased sharply in recent enforcement efforts, reflecting targeted patrols in high-crash areas.
Crime in North Charleston is not evenly distributed. While roughly half of analyzed neighborhoods receive average to above-average safety grades, others rank significantly lower. Long term, the city has historically been ranked among higher-risk areas nationally, but recent data suggests a gradual trend in the right direction. Local reporting confirms that the North Charleston crime rate continues to decline, even as property crime risks remain present in certain areas.
Downtown Charleston Crime Statistics and Trends

Downtown Charleston continues to experience declining overall crime, based on early 2025 and 2026 data, with notable reductions in violent offenses. The Charleston Police Department reported a 10.7 percent drop in overall crime in 2024, continuing a multi-year downward trend. Homicides fell by more than 47 percent, robberies dropped 22.7 percent, and sex offenses declined nearly 29 percent.
Downtown Charleston Crime Patterns
Violent Crime Improvements
| Crime Type | Change |
|---|---|
| Homicides | ↓ 47% |
| Robberies | ↓ 22.7% |
| Sex Offenses | ↓ 29% |
Property Crime Risks
| Crime Type | Trend |
|---|---|
| Theft From Vehicles | Increasing |
| Larceny | Persistent in tourist areas |
| Motor Vehicle Theft | Declining |
Crime varies block by block downtown, especially after dark.
Despite these improvements, downtown remains a high-activity area for property crime, particularly thefts from vehicles and larceny tied to dense foot traffic, nightlife, and tourism. While motor vehicle thefts declined sharply, thefts from vehicles increased slightly, reinforcing the risk of leaving valuables inside parked cars.
Law enforcement has also flagged increased youth involvement in certain violent and gun-related incidents involving teenagers, alongside ongoing drug enforcement operations in early 2026. While heavily patrolled areas like King Street see a strong police presence, parking garages, alleyways, and late-night venues continue to require added vigilance. Independent crime data sources consistently show downtown Charleston’s crime patterns vary block by block, especially after dark.
- 2025 Charleston Crime Statistics and How Home & Business Security Systems Can Help
- Charleston, SC Crime Rates
James Island Crime Statistics and Trends
James Island remains one of the more stable and residential-focused areas in the Charleston region. Based on 2024 and early 2025 data, the island has experienced declines across most major crime categories, aligning closely with broader citywide improvements.
James Island Crime Stability
Low-Risk Profile Checklist
| Indicator | Status |
|---|---|
| Overall Crime Trend | Declining |
| Violent Crime | Low |
| Property Crime | Mostly vehicle-related |
| Safest Areas | Riverland Terrace, Stiles Point |
Year-over-Year Crime Direction
| Crime Category | Direction |
|---|---|
| Homicide | ↓ |
| Robbery | ↓ |
| Sexual Offenses | ↓ |
| Burglary | ↓ |
| Vehicle Theft | ↓ |
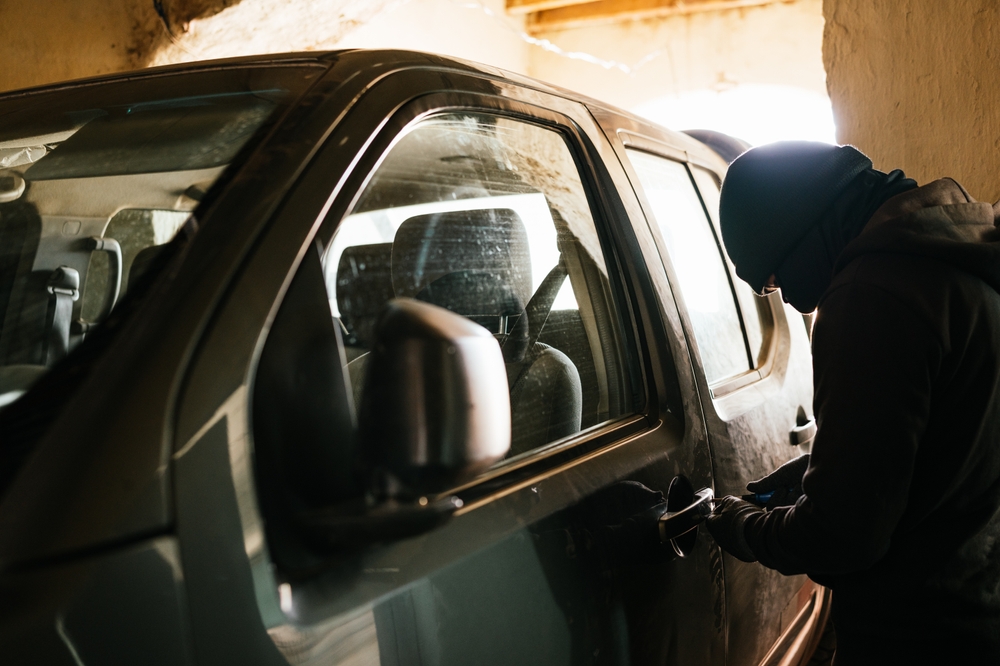
Local police report that property crime remains the most common issue, particularly thefts from vehicles. Law enforcement regularly emphasizes locking vehicles, removing valuables, and reporting suspicious activity. Violent crime levels remain relatively low, though isolated incidents do occur, including a targeted shooting reported in late 2025.
Charleston Police Department data shows notable reductions year over year, including sharp declines in homicides, robberies, sexual offenses, burglaries, and motor vehicle thefts. Riverland Terrace and Stiles Point are frequently cited as some of the island’s safest and most desirable neighborhoods. Overall, James Island is considered family-friendly, with crime rates lower than many parts of the country, though traffic congestion along Folly Road remains a common resident concern.
Mount Pleasant Crime Statistics and Trends
Mount Pleasant consistently ranks as one of the safest municipalities in South Carolina, with crime rates well below both state and national averages. With a population approaching 92,000, the town reports approximately 15 total crimes per 1,000 residents, compared to the South Carolina average of over 26 per 1,000.
Mount Pleasant Safety Comparison
Crimes Per 1,000 Residents
| Location | Crimes per 1,000 Residents |
|---|---|
| Mount Pleasant | 15 |
| South Carolina Average | 26+ |
| National Average | ~22 |
Additional Safety Metrics
| Metric | Value |
|---|---|
| Violent Crime Rate | ~0.8 per 1,000 residents |
| Population | ~92,000 |
| Property Crime Trend | Declining |
Violent crime remains exceptionally low, at roughly 0.8 incidents per 1,000 residents, while property crime, though more common, is still limited. Recent data suggests a slight uptick in violent incidents during 2025 and 2026 compared to earlier years, while property crime has generally declined.
The Mount Pleasant Police Department uses proactive, data-driven policing strategies, and community initiatives like the “9 PM Routine” and “Lock It, Lose It” campaigns have helped reduce theft from vehicles. Residents widely consider Mount Pleasant a safe community, with strong awareness around security measures and widespread use of surveillance systems.
West Ashley Crime Statistics and Trends
West Ashley and the broader Charleston area experienced continued crime reductions through 2024 and into early 2025, with overall citywide crime down more than 10 percent. Violent crime dropped roughly 5 to 6 percent, while homicides and robberies declined substantially.
West Ashley Crime Statistics and Trends
Overall Crime Direction
| Crime Category | Trend |
|---|---|
| Overall Crime | ↓ Declining |
| Violent Crime | ↓ Down 5–6% |
| Homicides | ↓ Notable decline |
| Robberies | ↓ Declining |
| Property Crime | ↓ Overall, but mixed |
| Theft From Vehicles | ↑ Slight increase |
Neighborhood-Level Variability
| Area Type | Trend |
|---|---|
| Residential neighborhoods | Generally improving |
| Commercial corridors | Mixed results |
| High-traffic areas | Elevated risk |
| Lower-density zones | Lower risk |
Property crime also fell across Charleston, though thefts from vehicles increased slightly. In West Ashley specifically, crime trends vary by neighborhood. Some areas saw significant decreases in nonviolent offenses such as burglaries, while others experienced increases in drug- and weapon-related offenses.
Aggravated assaults rose modestly, often involving younger offenders, which law enforcement attributes in part to post-pandemic activity patterns. Community policing efforts, increased patrols, and partnerships with local organizations have contributed to recent improvements. For precise neighborhood-level insight, city crime mapping tools provide the most accurate picture.
Summerville Crime Statistics and Trends
Summerville is a rapidly growing, family-oriented community with crime rates that vary significantly by neighborhood. Overall, crime levels range from moderate to slightly above national averages, though resident perception of safety remains generally positive.
Summerville Crime Snapshot
Homicide Trend Comparison
| Year | Homicides |
|---|---|
| 2024 | Record high |
| 2025 | 0 |
Primary Ongoing Concern
| Crime Type | Status |
|---|---|
| Property Crime | Most common issue |
| Violent Crime | Limited |
Violent crime exists but remains limited, and in a notable shift, Summerville reported zero homicides in 2025, down from a record high the year before. Property crime remains the most common issue, particularly theft and burglary, often linked to growth-related traffic and density increases.
Neighborhoods such as Pine Forest Country Club, Wescott Plantation, Cane Bay, Nexton, and Sangaree are consistently ranked among the safer areas. Experts recommend evaluating crime at the neighborhood level rather than citywide averages when assessing risk in Summerville.
Goose Creek Crime Statistics and Trends
Goose Creek reports a total crime rate of approximately 17 incidents per 1,000 residents, placing it near the national average for similarly sized cities. While the overall rate is slightly higher than some national benchmarks, Goose Creek is generally considered safer than more urban parts of the Charleston metro area.
Goose Creek Crime Metrics
Overall Crime Rate
| Metric | Value |
|---|---|
| Total Crime Rate | ~17 per 1,000 residents |
| National Comparison | Near average |
| Regional Comparison | Safer than denser metro areas |
Crime levels vary by neighborhood, though residents frequently report feeling safe and actively monitor local incidents. Property crime rates align closely with national averages, while violent crime is slightly elevated compared to some peer communities.
Statewide data shows South Carolina continuing a multi-year downward trend in crime, with decreases in both violent and property offenses. For the most current local insight, Goose Creek police publish regular monthly crime statistics.
What These Charleston-Area Crime Trends Have in Common
Across Charleston and surrounding communities, several patterns repeat:
- Criminals favor poorly lit properties
- Easy access points increase risk
- Visible security systems reduce targeting
Properties with professionally installed and monitored security systems are far less likely to be targeted multiple times.
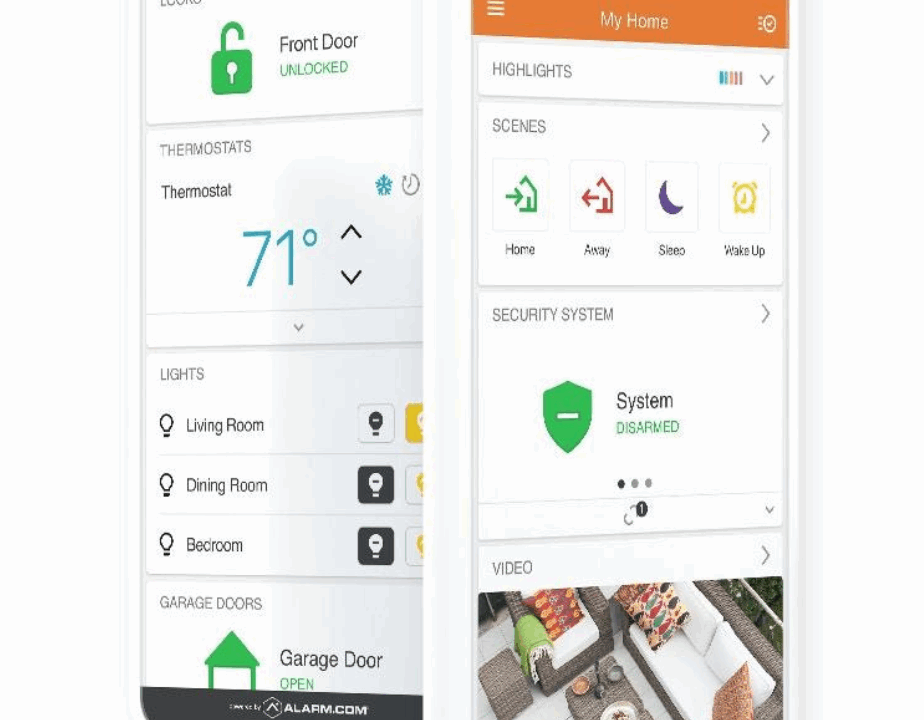
How Security Systems Help Reduce Crime Risk
Modern security systems provide:
- Real-time alerts
- Professional monitoring
- Video documentation for police
- Strong visual deterrence
A system designed around neighborhood-specific risk offers the best protection.
Final Thoughts
Understanding Charleston crime trends by neighborhood helps property owners stay proactive rather than reactive. While no area is immune to crime, the right security setup dramatically reduces risk and improves peace of mind.
A local security assessment ensures your system is designed for your property, your neighborhood, and current crime patterns.