Charleston-area property crime does not hit every zip code the same. And even when overall crime trends improve year to year, the “where” and “when” still matter a lot for break-ins, vehicle break-ins, and theft.
This guide compares downtown Charleston vs Mount Pleasant, explains which areas tend to see more risk, and calls out the times of day when incidents are more likely.
Downtown Charleston vs Mount Pleasant Crime Rates
Mount Pleasant is consistently one of the safer communities in the region, with significantly lower violent crime and a lower overall crime rate than Charleston’s downtown core. Based on the data you provided, Mount Pleasant’s property crime rate is about 13 incidents per 1,000 residents, and violent crime is roughly 1 per 1,000 residents, with overall crime trending down over time.
| Metric | Downtown Charleston | Mount Pleasant |
|---|---|---|
| Overall Crime Rate | Higher | Lower |
| Violent Crime | Improving, still present | Very low |
| Property Crime | Elevated due to density | Moderate |
| Crime Trend | Downward overall | Downward, low baseline |
| Primary Risk Type | Larceny, vehicle break-ins | Vehicle and package theft |
Downtown Charleston, on the other hand, is a high-traffic peninsula with tourism, nightlife, parking garages, short-term rentals, and dense commercial corridors. Even with crime trending downward overall, downtown can still be a hotspot for larceny and thefts from vehicles due to opportunity and volume.
What the Latest Trendlines Say
Downtown Charleston trendline (overall improving, but still “opportunity heavy”)
Your data shows the Charleston Police Department reported a 10.7% drop in overall crime in 2024, with major drops in serious violent categories, including:
- Homicides down more than 47%
- Robberies down 22.7%
- Motor vehicle theft down 27.9%
Downtown Charleston Crime Trendline
| Crime Category | Change |
|---|---|
| Overall Crime (2024) | ↓ 10.7% |
| Homicides | ↓ 47% |
| Robberies | ↓ 22.7% |
| Motor Vehicle Theft | ↓ 27.9% |
| Theft From Vehicles | ↑ 0.7% |
But property crime pressure remains, especially:
- Theft from motor vehicles, which saw a slight increase (0.7%)
Translation: downtown can be “safer overall” while still being a place where people get hit for what’s left inside their car.
Mount Pleasant trendline (low baseline risk, steady improvements)
From your Mount Pleasant write-up:
- Property crime: 13 per 1,000 residents (about a 1 in 76 chance)
- Violent crime: roughly 1 per 1,000 residents (about 1 in 685)
- Total crime: about 15 per 1,000, well below statewide averages
- Overall trend: generally downward, with small year-to-year bumps
Mount Pleasant Crime Snapshot
| Crime Type | Rate |
|---|---|
| Property Crime | ~13 per 1,000 residents |
| Violent Crime | ~1 per 1,000 residents |
| Total Crime | ~15 per 1,000 residents |
| Overall Direction | Generally downward |
Mount Pleasant also benefits from:
- More residential layout and less density
- Higher levels of neighborhood lighting, HOA rules, and camera adoption
- Strong public safety messaging (lock cars, lighting routines, neighborhood alerts)
Neighborhoods: Where the Risk Is Higher
Downtown Charleston: areas that require more awareness
Downtown is not “one neighborhood.” It’s pockets that behave differently.
Higher-risk patterns tend to show up around:
- Nightlife corridors (especially Upper King area late night)
- Parking garages and large lots
- Tourist-heavy clusters where people carry bags and valuables
- Short-term rental zones with frequent turnover and unknown routines
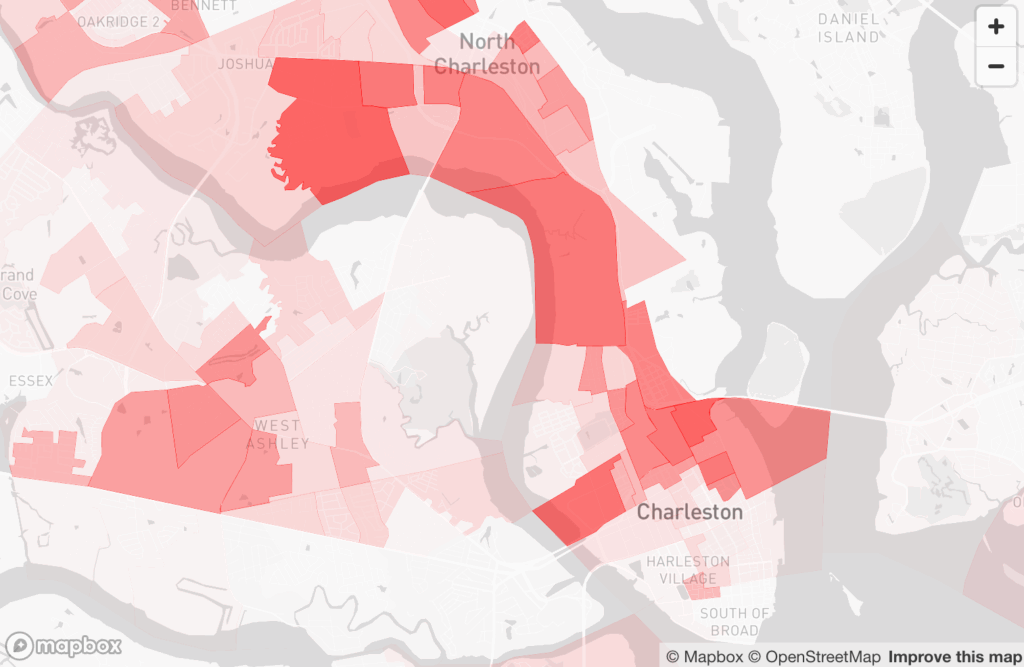
Interactive Map of Downtown Charleston
Downtown areas that are typically safer for walking and daily activity
These are heavily visited, well-patrolled areas, but still not immune to vehicle break-ins:
Areas to be more cautious about at night in Downtown Charleston
Based on your local-travel style notes, the key is less about fear and more about “avoid empty streets”:
- Quieter side streets after bars close
- Dim parking areas
- Less trafficked blocks east of the main tourism corridors
Mount Pleasant: generally very safe, with a few “common sense” zones
Mount Pleasant’s risk is lower, but property crime can still happen, especially:
- Near busy commercial stretches
- Around parking lots where criminals can move quickly
- In areas where people leave vehicles unlocked or leave valuables inside
From the Mount Pleasant neighborhood safety list you provided, these are commonly cited as exceptionally safe areas:
- Dunes West
- Rivertowne
- Park West
- Brickyard Plantation
- Longpoint
- Planter’s Pointe
- Snee Farm
- Hamlin Plantation
- Hobcaw Point
In Mount Pleasant, the most common “crime story” is still usually theft from vehicles and porch/package theft near higher-traffic zones, not violent incidents.
Times of Day: When Break-Ins and Theft Spike
This part matters most for prevention.
Downtown Charleston: highest-risk windows
Late night to early morning (roughly 10 pm to 4 am)
- Nightlife crowds thin out
- People leave cars in garages and side streets
- Criminals look for easy grabs from vehicles
- Short-term rentals can be targeted when routines are obvious
Weekend nights
- More visitors
- More distracted behavior (bags in back seats, doors not checked)
- More parked cars in garages and lots
Daytime “opportunity crime” (tourist hours)
- Larceny can happen in busy areas simply because there are more targets
Mount Pleasant: highest-risk windows
Evening and overnight
- Driveway and street-parked vehicle break-ins
- Garage-checking behavior
- Quick hit property crimes, often based on unlocked access
After-school and evening hours near retail
- “Other” offenses and nuisance calls trend closer to commercial strips like Coleman Boulevard
- These rarely spill deep into the residential neighborhoods listed above, but they can inflate local incident totals
Downtown vs Mount Pleasant: What this means for homeowners and businesses
Why Mount Pleasant Has Lower Crime Risk
| Factor | Impact |
|---|---|
| Residential layout | Lower density |
| Neighborhood lighting | Strong |
| HOA rules and oversight | Common |
| Camera adoption | Widespread |
| Public safety messaging | Consistent |
If you live downtown
Your best protection strategy is to reduce opportunity:
- Prioritize camera coverage of entry points
- Add motion lighting for alleys, side yards, and rear entrances
- Use door and window sensors plus glass-break detection for older windows
- For rentals, use smart locks and routine-based lighting schedules
If you live in Mount Pleasant
The risk is lower, but the prevention approach is consistent:
- Lock cars every night and remove valuables
- Cover driveway and front porch with a visible camera
- Use lighting that eliminates dark zones near garage doors
- If you back up to marsh or wooded buffers, cover the side yard path
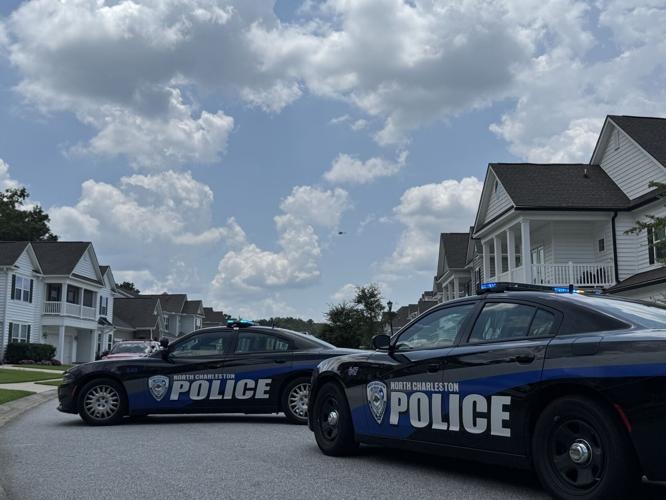
A quick note on North Charleston
Even though this post focuses on downtown vs Mount Pleasant, it’s worth noting North Charleston’s trendline since it impacts how people interpret “Charleston area crime.”
Per your data, North Charleston saw an 11% decrease in violent crime through September 2025, with homicides down 38% and robberies down 15%, alongside continued concerns around vehicle theft and DUI enforcement. Local reporting also confirms the North Charleston crime rate continues to decline using this source as requested:
North Charleston Crime Snapshot
| Metric | Change |
|---|---|
| Violent Crime | ↓ 11% |
| Homicides | ↓ 38% |
| Robberies | ↓ 15% |
| Vehicle Theft | Ongoing concern |
| DUI Enforcement | Increased |
North Charleston crime rate continues to decline
That’s a good example of how crime can be improving overall while property crime prevention still matters day to day.

